Resource Centre - Patient Dashboard
 Return to Resource Centre
Video Tutorial
The Patient Dashboard is the first screen that displays when you access a patient’s record and is a great tool for creating a single location for displaying data you view on a regular basis.
If you are a first-time ClinicalConnect user, the Dashboard will be empty. You will need to populate the dashboard with clinical modules according to your clinical needs. Drag and drop the module icons found in the Patient Dashboard Header to add modules to your dashboard. The Patient Dashboard can also be accessed at any time by clicking the Dashboard: Patient option from the Clinical Modules menu.
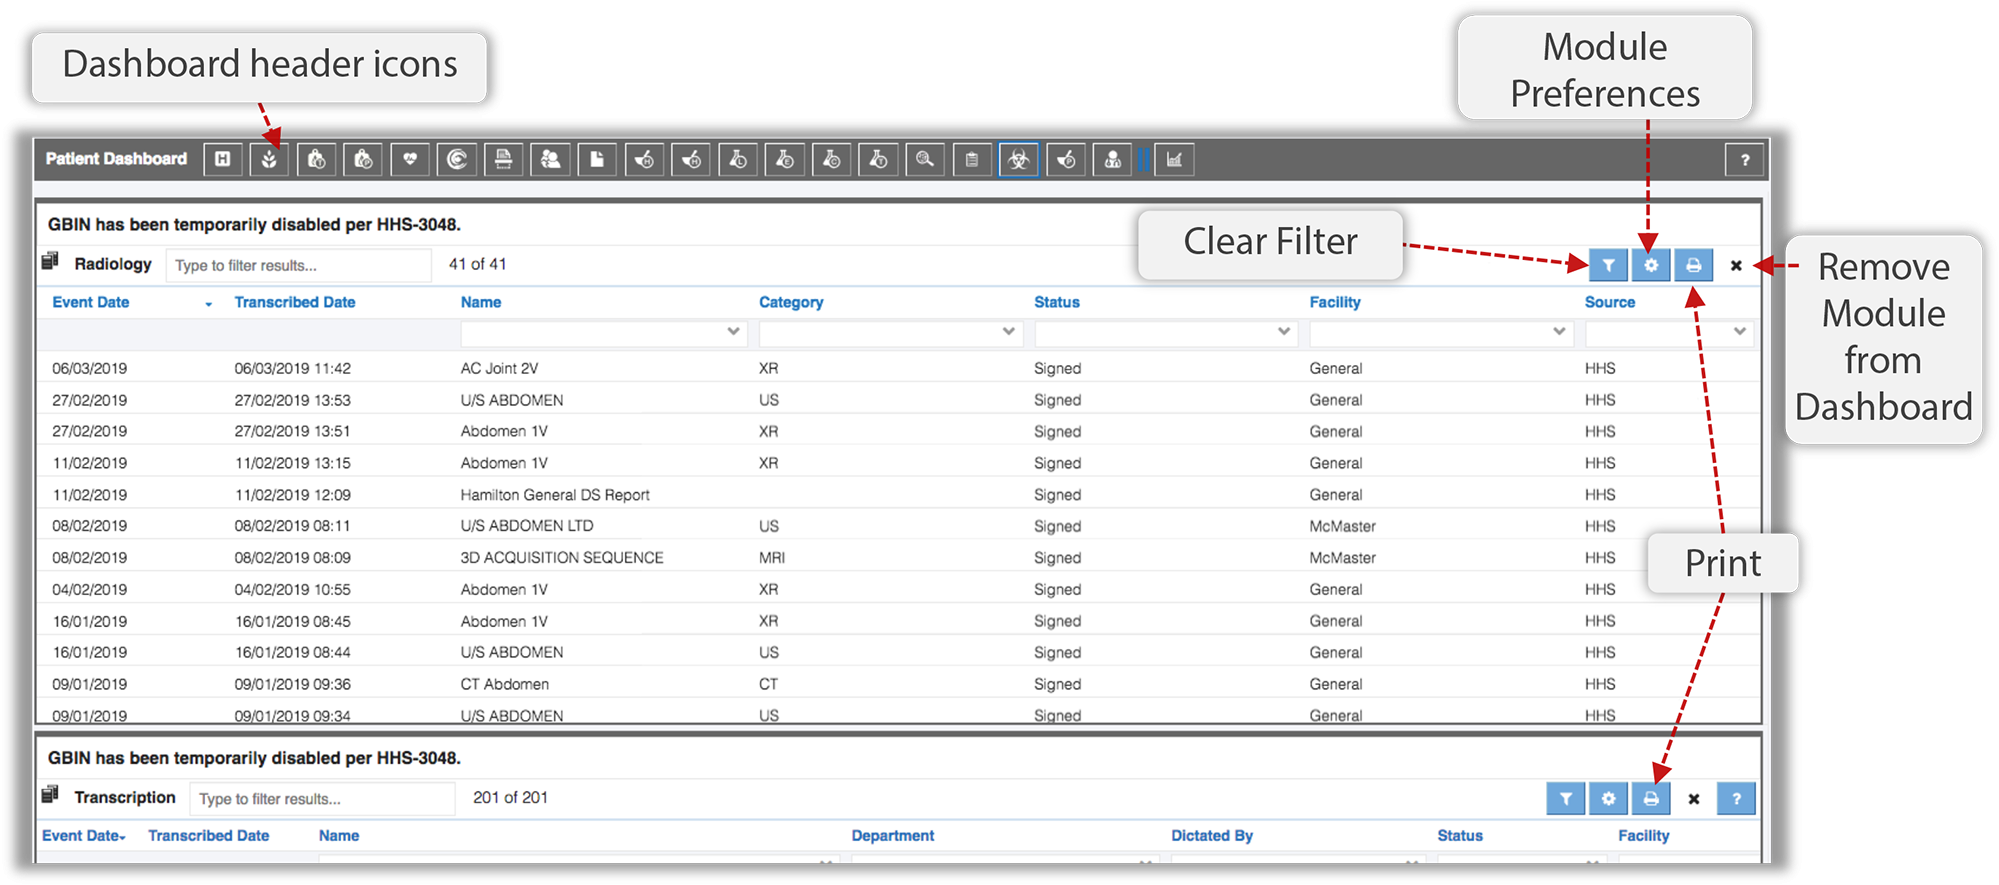
The following table provides a summary of some of the key Dashboard features.
| Feature | Summary |
|
Dashboard header icons |
Each icon in the Dashboard header represents a clinical module. Dragging a module icon and releasing it below the Dashboard header adds that module to the dashboard view. |
| Smart Filter |
Text typed in the Smart Filter Search box narrows the list of results to display only those related to text you entered. |
|
Module Preferences
|
Used to access to the module’s preferences.
|
|
Remove Module from Dashboard
|
Used to remove the module from the Dashboard view. |
|
Column Filter bar
|
Contains column filters (date and keyword filters) used to filter data to narrow down the information presented in the module’s list view. The Clear Filters button is used to reset all Column Filters in the view. See the Column Filter page to learn more about this feature. |
|
|
Clicking the Print button allows you to print the contents of the selected module. |


 You can also use the


 The buttons that appear in the module headers in the Dashboard do not always match the buttons you will see if you launch the full module from the navigation bar on the left.
Each icon in the Dashboard header represents a clinical module or a specific module tab within a module:
| Dashboard Icon | Related Module or Module Tab |
 |
Admissions module |
 |
Allergies module |
|
|
Blood Bank: Tests module |
|
|
Blood Bank: Products module |
|
|
Cardiology module |
|
|
Home and Community Care module |
 |
Health Records module |
 |
Face Sheet module |
 |
Pharmacy: Home Meds modules |
 |
Labs: List module |
|
Labs: Expanded module |
|
Labs: Components module |
|
Labs: Trended module |
 |
Microbiology module |
 |
Orders module |
 |
Pathology and Genetics module |
|
Pharmacy module |
 |
Radiology module |
 |
Visits module |


Adding Modules to Your Dashboard
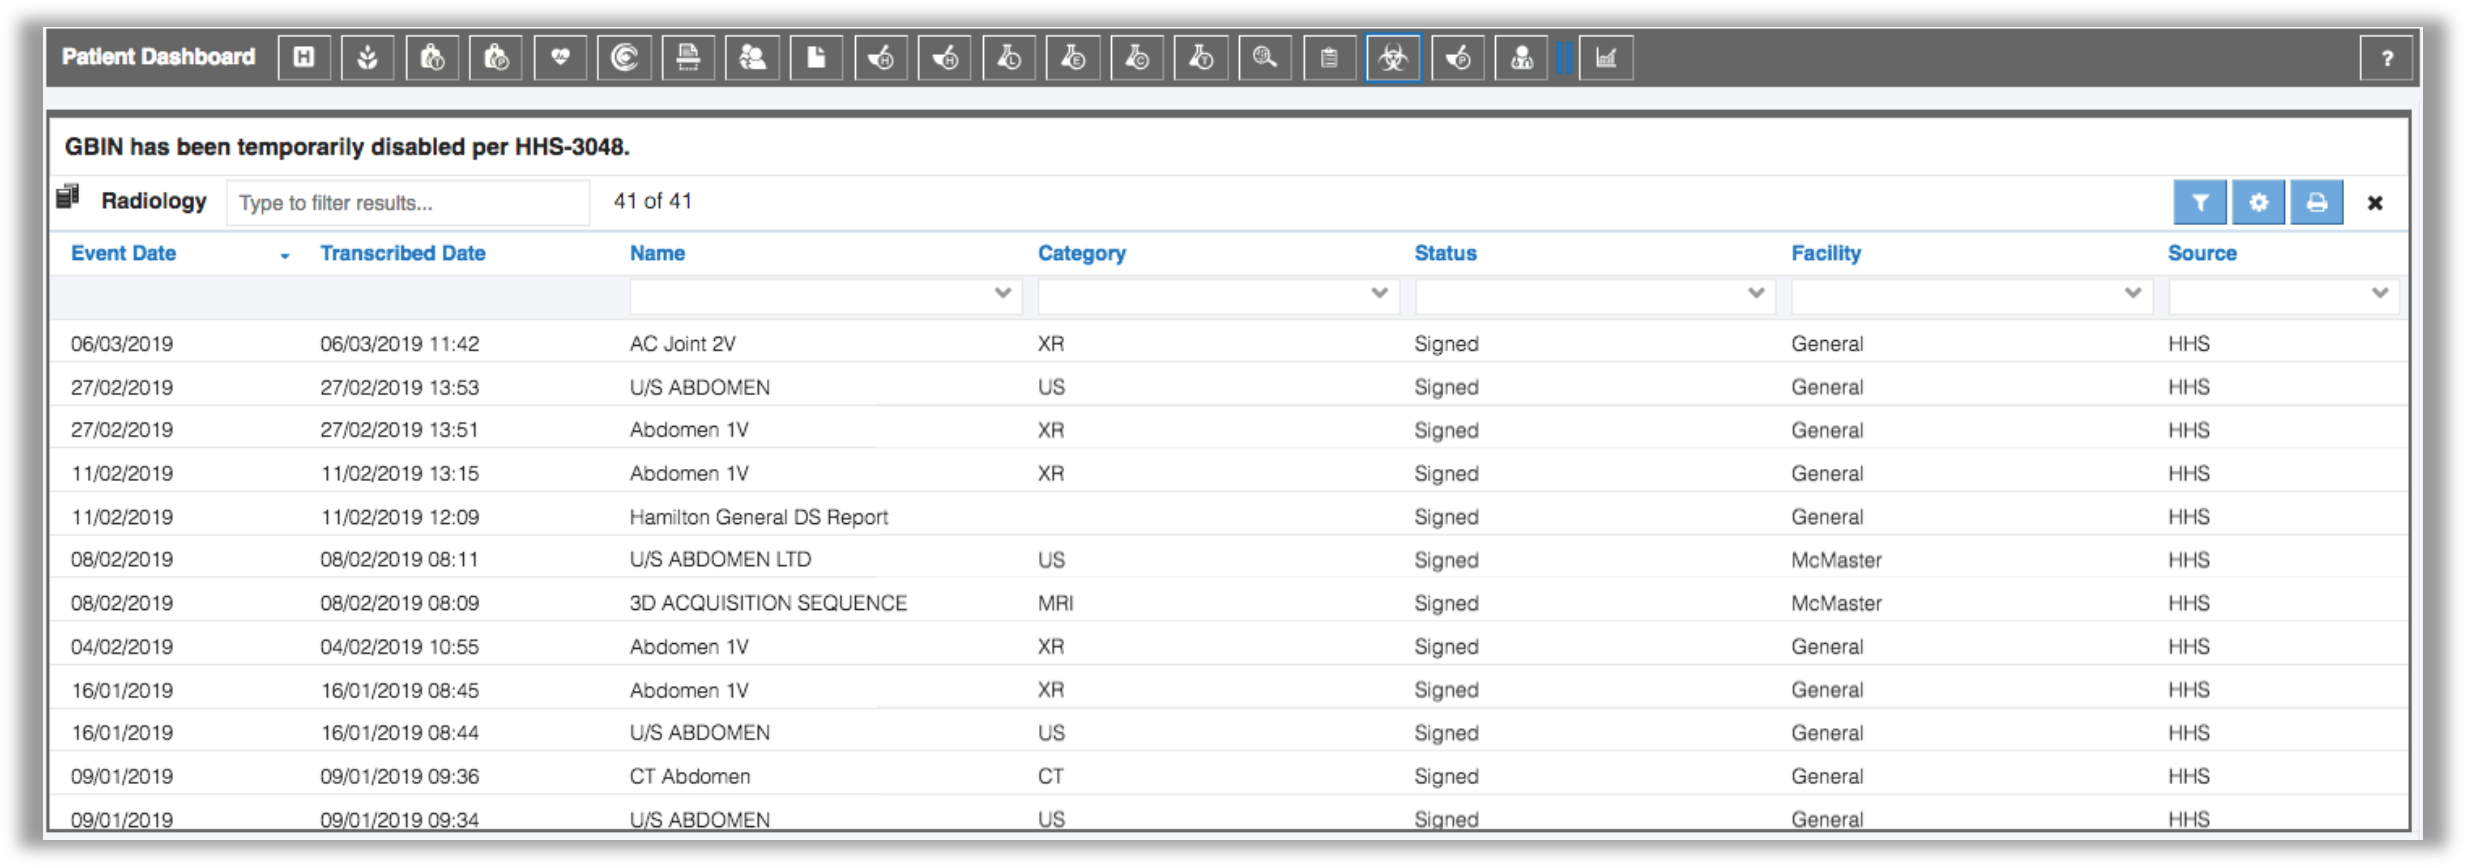
The first time you access the dashboard it’ll appear somewhat empty with the exception of the Patient Dashboard header.
To add modules to your dashboard:
1. Click and drag the icon of the module you want to add to your dashboard and drop it into the space below the Patient Dashboard header.

2. The module will display its results based on the module’s preferences.
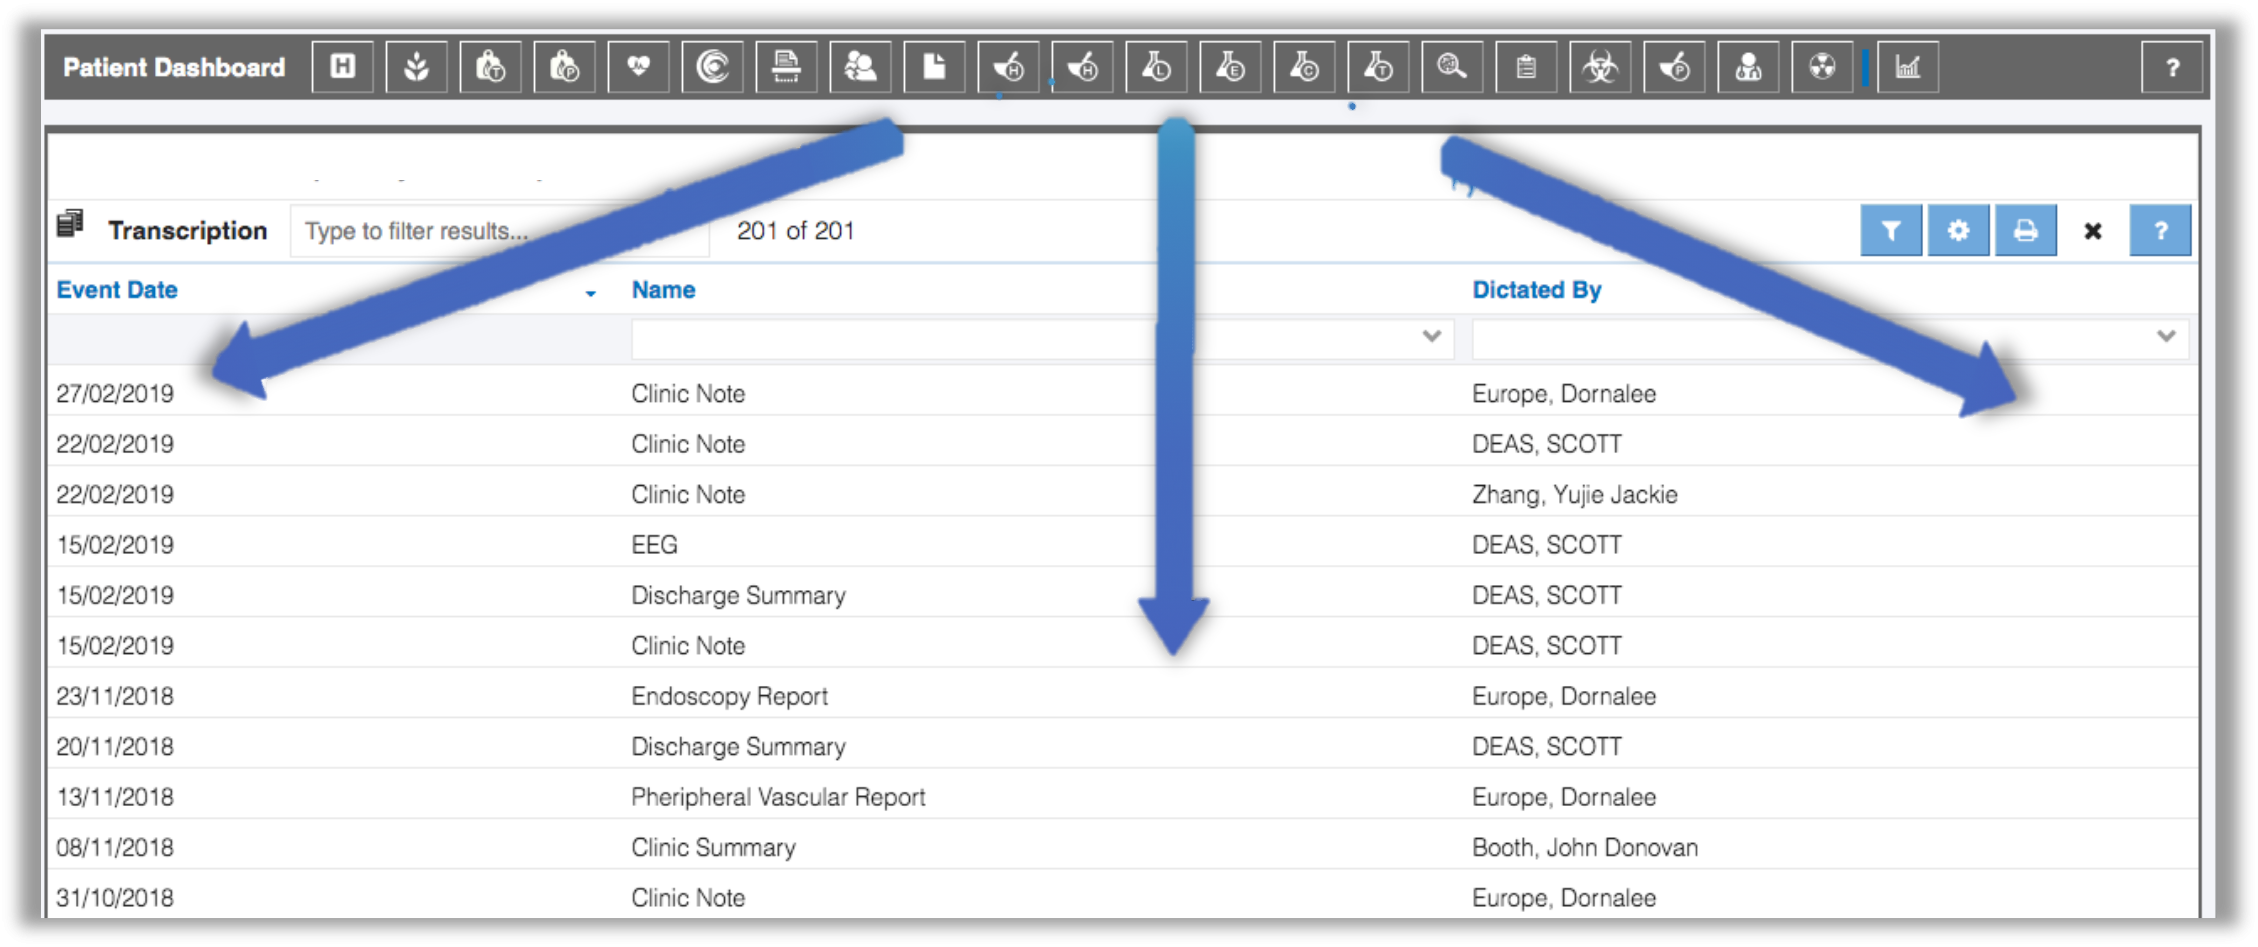
3. To add another module, click and drag the icon of the module you want to add and drop it beside, below or above an existing module in the dashboard.
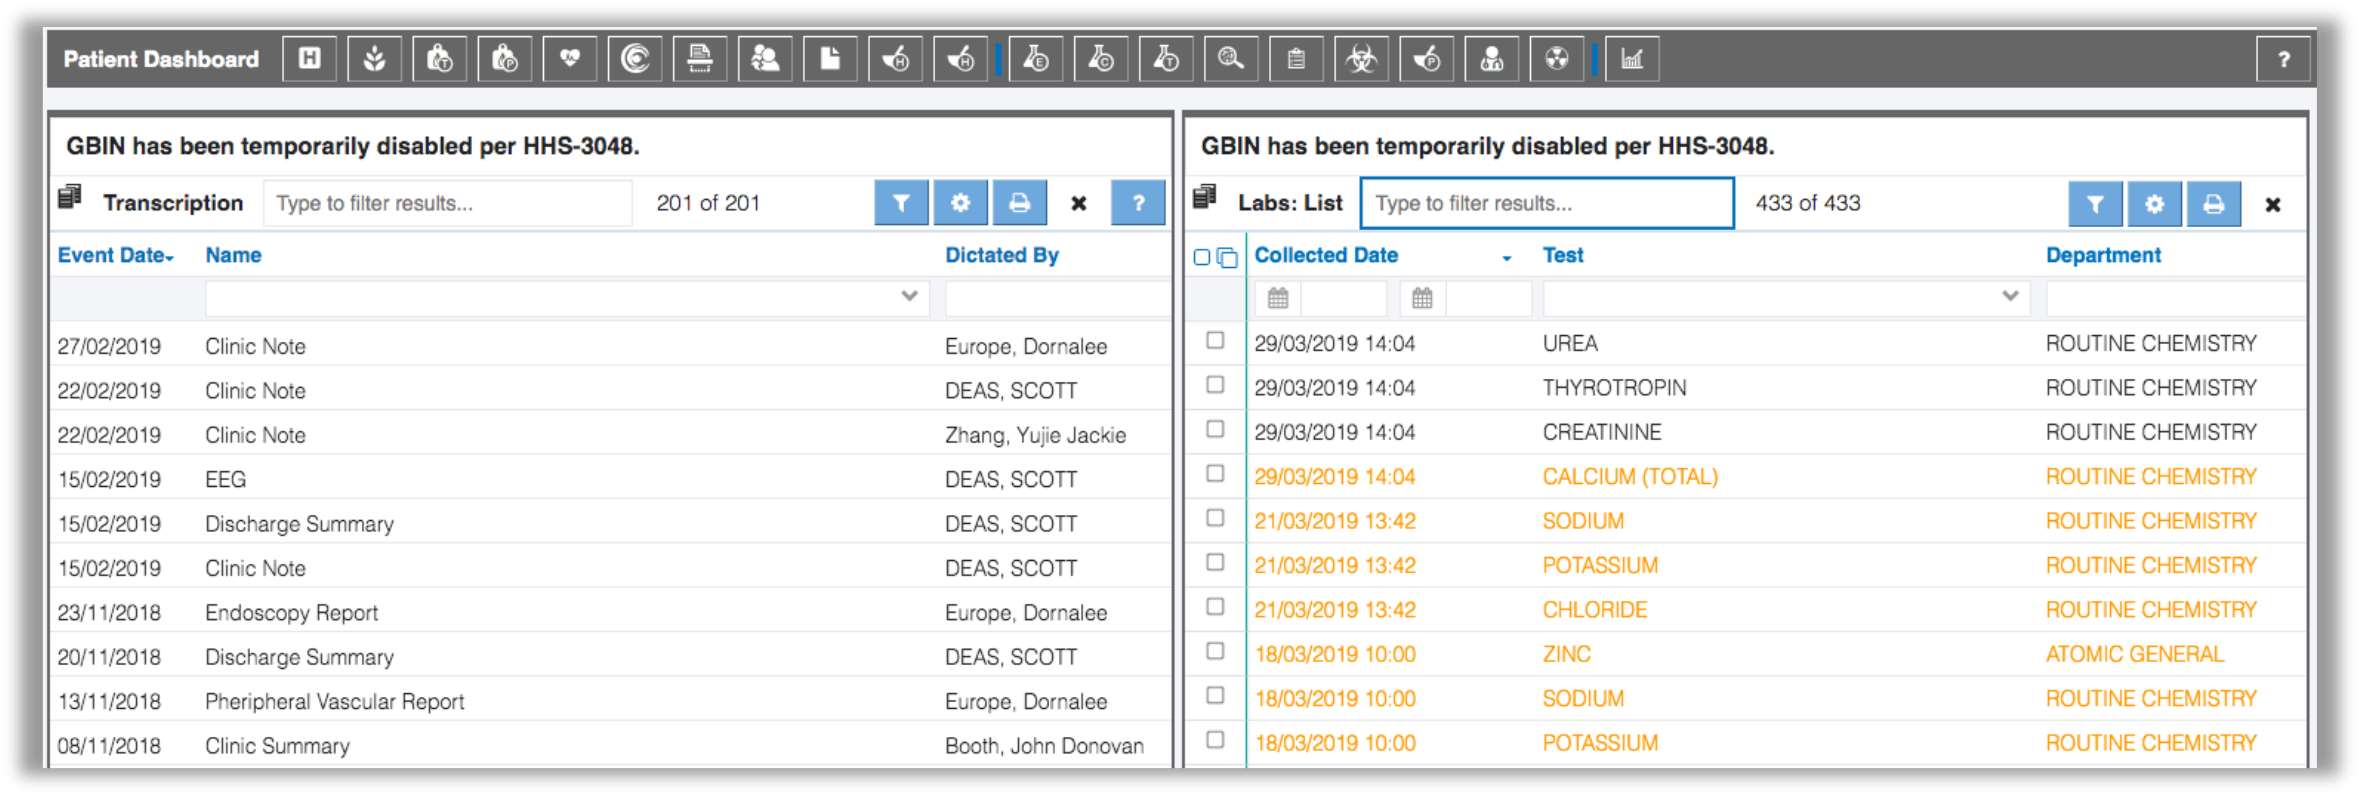
This example shows the Labs: List module placed beside the Transcription module. Both modules appear in a side-by-side view:

This example shows the Microbiology module placed below the Labs and Transcription modules:

The Transcription module will take up the entire width of the dashboard until another module is added beside it.
Removing Modules from Your Dashboard
To remove a module from your dashboard click the Close button  in the header of the module you want removed.
Once a module is removed from the dashboard it’s module icon returns to the dashboard header. You can add the module back into the dashboard at any time.
Viewing Result Details in the Dashboard
The details of a selected report or test, when accessed from the Dashboard view, will display in the module window as shown below.
Click the close button  in the Details header to return to the module's list view in the dashboard.
